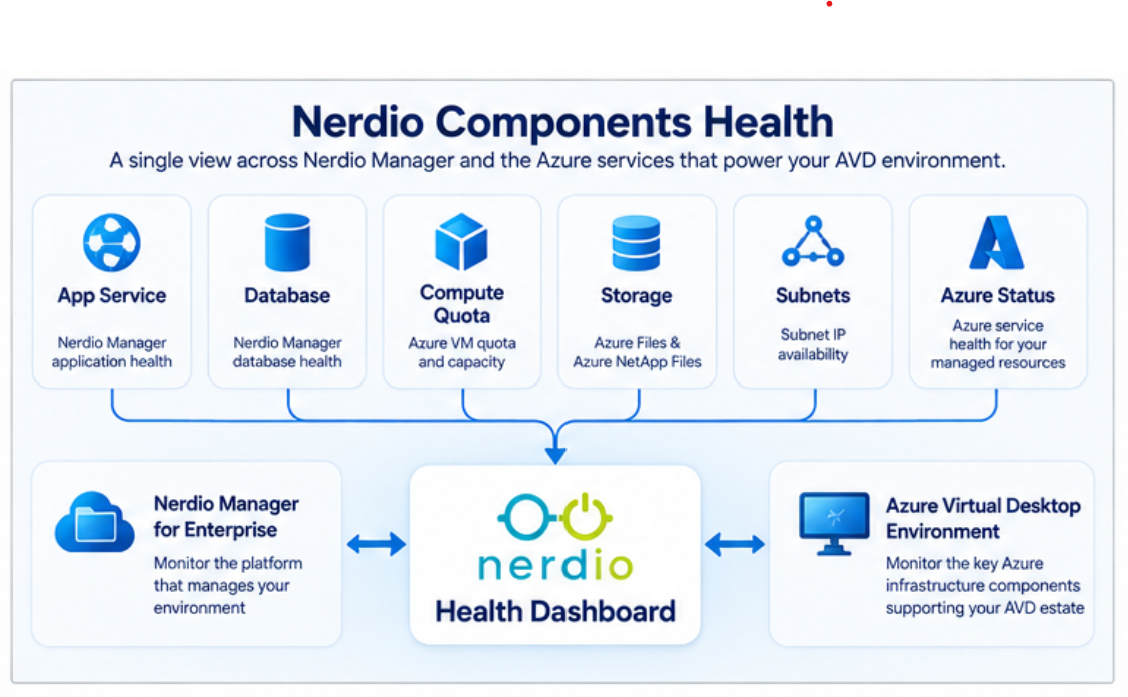
Keeping an Azure Virtual Desktop environment healthy involves monitoring much more than whether your session hosts are running.
AVD depends on multiple Azure services, including compute capacity, networking, profile storage and the wider Azure platform. Add Nerdio Manager for Enterprise (NME) itself into that architecture and administrators potentially have many different areas to monitor.
Nerdio's improved Health Dashboard helps bring that information together into a single view.
Available from:
Nerdio Manager → Insights → Health
The dashboard provides a quick visual indication of the health of both Nerdio Manager and the Azure infrastructure supporting your managed environments.
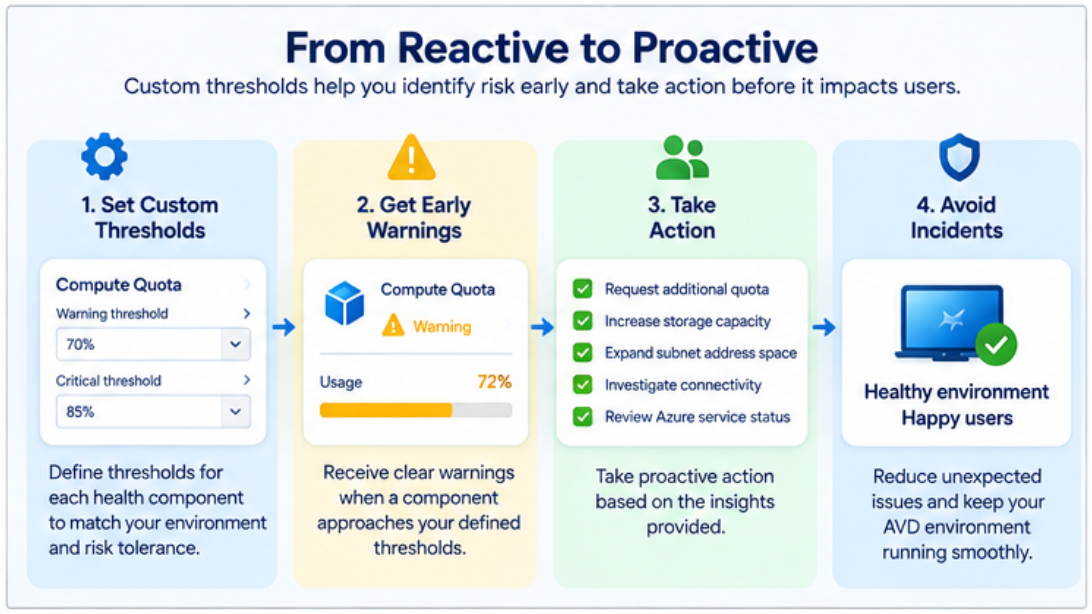
But one of the improvements I particularly like is the ability for customers to define thresholds for the individual health components.
This is important because what represents a warning condition in one AVD environment may be perfectly acceptable in another.
Let's take a closer look.
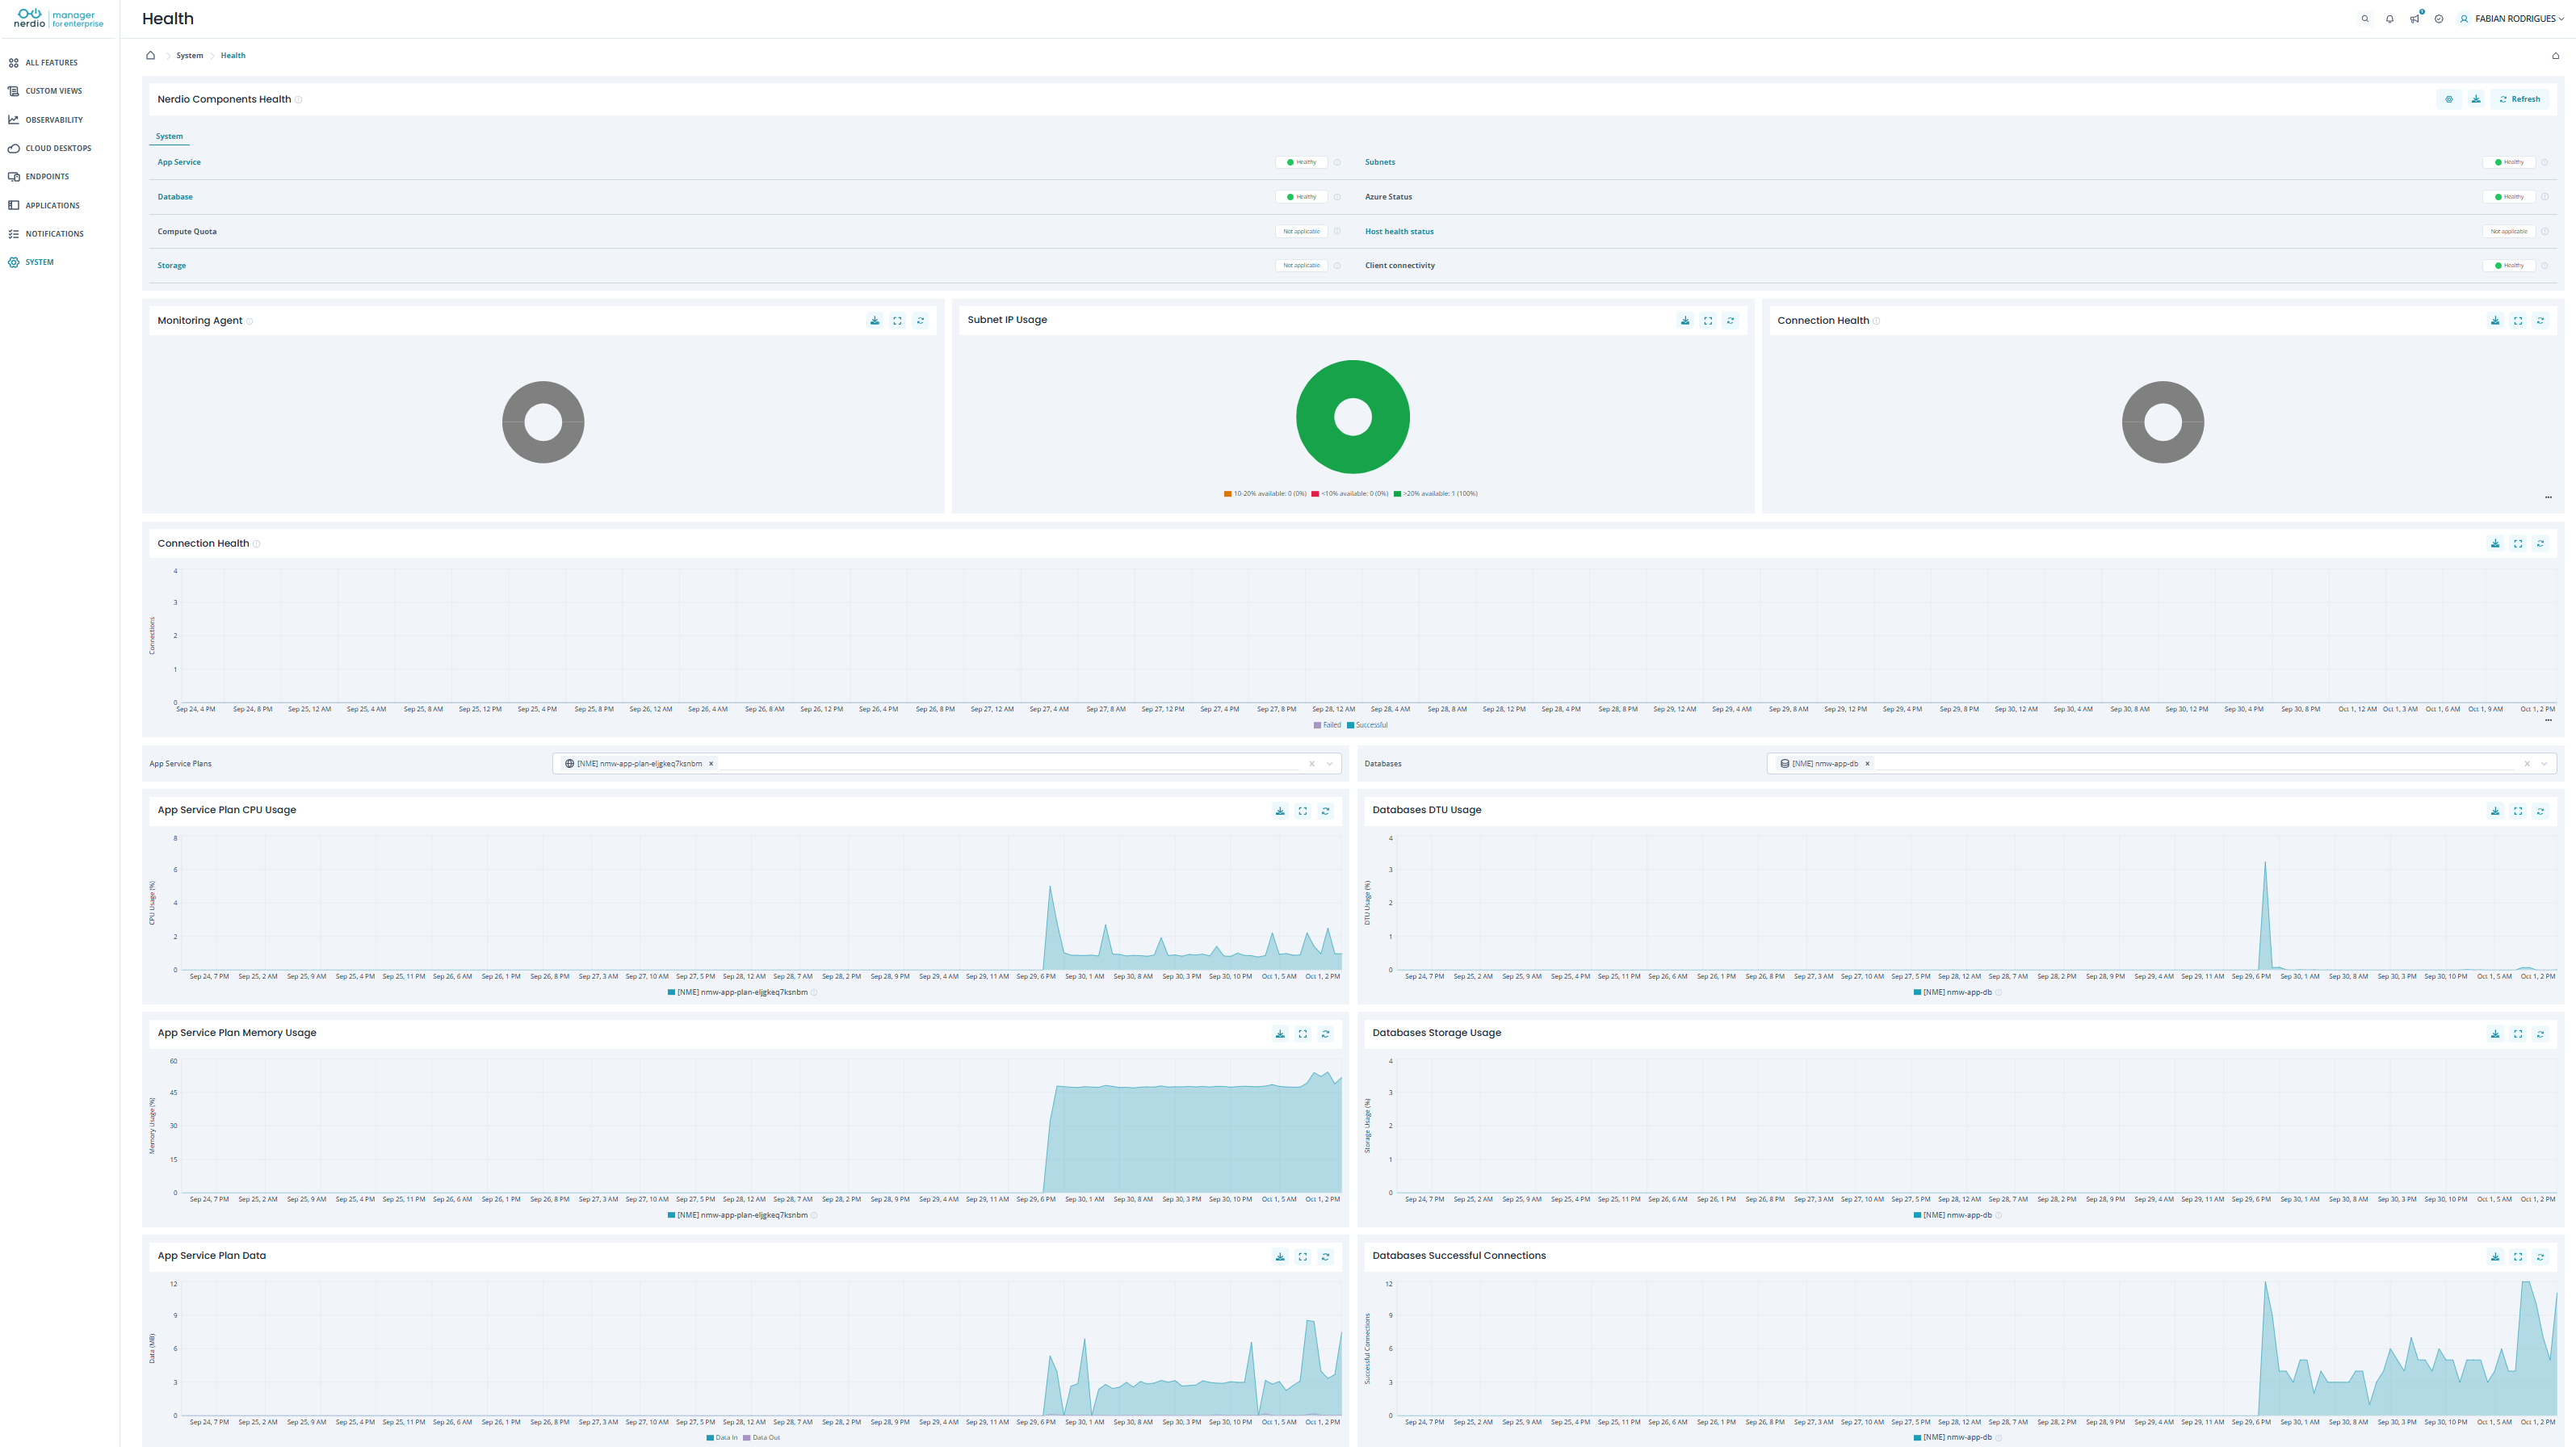
🎥 Nerdio Health Dashboard
The Health page provides a number of dashlets, but the area I want to concentrate on is Nerdio Components Health.
Nerdio uses a familiar RAG model:
🟢 Healthy
🟠 Warning
🔴 Unhealthy
Rather than simply displaying raw Azure metrics, this gives administrators an immediate indication of components that may require investigation.
The component health view currently covers:
App Service | Database | Compute Quota | Storage | Subnets | Azure Status | Hosts | Client Connectivity
Let's look at what each actually means.
App Service
The App Service health indicator relates to the Azure App Service underpinning Nerdio Manager.
If this moves into a warning or unhealthy state, it can indicate an issue affecting Nerdio Manager itself rather than the customer's AVD session hosts.
This distinction is useful.
An AVD environment could technically be operational while the management platform is experiencing a performance or availability issue.
Administrators should therefore think of this as:
Is the Nerdio Manager application layer healthy?
Microsoft provides additional App Service diagnostics for investigating availability, CPU, memory, networking, application errors and other runtime issues.
💡 Fabs Field Recommendation
If App Service becomes unhealthy, don't immediately start troubleshooting AVD.
First determine whether the problem is with Nerdio Manager, the underlying Azure App Service, or the managed AVD environment.
Database
Nerdio Manager also relies on its database.
The Database indicator identifies when the Nerdio Manager database requires attention.
This is another important distinction because a database issue could affect the management platform without necessarily meaning the AVD control plane or session hosts themselves are unavailable.
Nerdio's wider Health dashboard also includes dedicated database metrics such as:
- Database CPU usage
- Database DTU usage
- Successful database connections
This gives administrators somewhere to investigate further when the overall database health changes.
Think of this component as:
Is the Nerdio Manager data layer healthy and able to support the management platform?
Compute Quota
This is one of the indicators I would pay particularly close attention to in larger AVD environments.
The Compute Quota component monitors current vCPU usage across the Azure subscriptions and regions managed through Nerdio.
Azure VM quota is enforced both at the total regional vCPU level and at individual VM family levels.
Why does that matter?
Imagine Nerdio Autoscale needs to deploy additional session hosts during the morning logon peak.
If the required VM family quota has been exhausted:
Demand increases
↓
Nerdio attempts to add capacity
↓
Azure quota reached
↓
New session host cannot be deployed
↓
Available AVD capacity doesn't increase
Microsoft confirms that VM deployments are prevented when either the VM-family quota or total regional vCPU quota would be exceeded.
💡 Fabs Field Recommendation
Don't wait until compute quota reaches 100%.
Set a warning threshold that gives your operations team enough time to request additional Azure quota before Autoscale or host deployment is affected.
Quota is a capacity-planning metric, not just a troubleshooting metric.
Storage – Azure Files and Azure NetApp Files
The Storage health component monitors Azure Files shares and Azure NetApp Files associated with the managed environment.
For AVD customers, this is particularly important because these services are commonly used for FSLogix Profile Containers.
A storage capacity problem can quickly become a user-experience problem.
For example:
Profile storage approaches capacity
↓
FSLogix operations affected
↓
Profile problems
↓
User logon or application issues
Azure Files integrates with Azure Monitor, while Azure NetApp Files exposes metrics covering allocated storage, consumed storage, IOPS, latency and capacity utilisation.
💡 Fabs Field Recommendation
Profile storage should never be treated as "create it and forget it."
Monitor both capacity and performance.
Where FSLogix is involved, storage is directly in the user's logon and application-data path.
This is another area where configurable thresholds are particularly valuable. An organisation may want an early warning well before its profile storage reaches a critical level.
Subnets
The Subnets component monitors available IP addresses.
This is easily overlooked when operating AVD at scale.
Every AVD session-host NIC requires an available IP address from its subnet. If the subnet approaches exhaustion, the ability to deploy additional session hosts can be affected.
Consider Autoscale again:
User demand increases
↓
Additional session hosts required
↓
Nerdio creates VM
↓
Subnet has insufficient IP capacity
↓
Deployment fails
A healthy VM quota therefore doesn't necessarily mean you can successfully scale.
You also need sufficient network capacity.
💡 Fabs Field Recommendation
Treat subnet IP availability in the same way as compute quota.
Both should provide early-warning capacity indicators, particularly for environments using dynamic scaling.
The appropriate threshold depends heavily on environment size. Twenty remaining addresses could be comfortable for a small environment but critically low for an AVD estate capable of adding dozens of hosts during a scale-out event.
Azure Status
Sometimes the problem isn't your configuration at all.
The Azure Status component shows the health of Azure services directly associated with resources being managed through Nerdio.
This can help administrators quickly identify whether an apparent AVD or infrastructure problem correlates with a wider Microsoft Azure service issue.
Microsoft's Azure Service Health provides personalised information covering:
- Active service issues
- Planned maintenance
- Health advisories
- Issues affecting services and regions you use
That context is valuable during incident response.
Instead of spending 30 minutes investigating your configuration, you may quickly identify that the underlying Azure service is experiencing an incident.
Hosts
The Hosts health indicator identifies unavailable session hosts within managed host pools.
This provides another useful operational signal.
An unavailable host might represent an isolated VM problem.
But multiple unavailable hosts could indicate something broader involving:
AVD Agent
Networking
Domain/Entra connectivity
Image changes
Azure platform
or another shared dependency.
The value of the dashboard is therefore not simply identifying a red component — it is helping administrators determine where to begin investigating.
Client Connectivity
Finally, we have one of the most user-focused metrics: Client Connectivity.
This highlights unsuccessful desktop connection attempts.
That is important because infrastructure can appear healthy while users are still unable to connect.
Microsoft defines a successful AVD connection as one that reaches the session host. Failed connections can therefore help identify issues affecting the path between the user and their desktop.
Nerdio also provides a Connection Health dashlet showing successful versus failed connections over the previous seven days.
This allows administrators to move from: “The servers are healthy.”
to: "Are users actually connecting successfully?"
💡 Fabs Field Recommendation
Infrastructure health and user-experience health aren't the same thing.
Monitor both.
A green VM doesn't necessarily mean a user can successfully reach their desktop.
Why Custom Health Thresholds Matter
For me, this is where the improved Health Dashboard becomes much more useful.
Not every AVD environment is the same.
Consider compute quota.
A small environment might consume: 40 / 100 vCPUs
while a large environment might consume: 4,000 / 5,000 vCPUs
The percentage remaining doesn't tell the complete story.
The same applies to subnet capacity and storage.
A threshold should represent the point at which your organisation needs to take action.
Instead of accepting a generic definition of healthy, warning and unhealthy, customers can define thresholds that better reflect their own operational requirements.
That changes the dashboard from simply being:
"What is broken?"
towards:
"What is approaching the point where I need to take action?"
And that is a much more useful operational model.
From Reactive to Proactive AVD Operations
The real value of the Nerdio Health Dashboard is therefore not the number of green boxes on the screen.
It's the ability to identify risk before users are affected.
For example:
Compute quota approaching threshold
→ Request quota increase.
Subnet availability approaching threshold
→ Expand or redesign network capacity.
Storage approaching threshold
→ Increase capacity or investigate profile growth.
Client connectivity warning
→ Investigate unsuccessful AVD connections.
Azure Status warning
→ Check Azure Service Health before troubleshooting internally.
App Service or Database warning
→ Investigate Nerdio Manager platform health.
This is the difference between monitoring and operational intelligence.
Final Thoughts
I really like the direction Nerdio has taken with the improved Health Dashboard……………… AVD is not a single service.
A production environment depends on compute, networking, storage, identity, the AVD control plane and, when using Nerdio Manager, the Nerdio application and database layers.
Bringing these signals together provides administrators with a much clearer picture of overall platform health.
But the ability to customise the health thresholds is particularly important.
Every customer has different scale, capacity requirements, operational processes and tolerances.
The goal shouldn't be to wait for infrastructure to fail.
It should be to identify when something is moving towards a state where intervention will soon be required.
My recommendation would therefore be:
Don't simply accept the default thresholds.
Review Compute Quota, Storage, Subnet availability and Client Connectivity against the normal behaviour of your environment and configure thresholds that provide your operations team enough time to act.
That's when a health dashboard becomes genuinely useful.
📚 Nerdio & Microsoft Reference Library
Nerdio – Insights: Health
The primary reference for the Nerdio Manager Health Dashboard, including Nerdio Components Health, Monitoring Agent, Connection Health, App Service and database metrics.
https://nmehelp.getnerdio.com/hc/en-us/articles/35702651636237-Insights-Health
Microsoft – Azure VM vCPU Quotas
Explains regional and VM-family vCPU quota and how quota can prevent new VM deployments.
https://learn.microsoft.com/en-us/azure/virtual-machines/quotas
Microsoft – Monitor Azure Files
Azure Monitor guidance covering Azure Files metrics, logs and diagnostic settings.
https://learn.microsoft.com/en-us/azure/storage/files/storage-files-monitoring
Microsoft – Azure NetApp Files Metrics
Covers capacity, usage, IOPS, latency, throughput and other ANF monitoring metrics.
https://learn.microsoft.com/en-us/azure/azure-netapp-files/azure-netapp-files-metrics
Microsoft – Azure Service Health
Guidance for monitoring Azure service issues, planned maintenance and health advisories.
https://learn.microsoft.com/en-us/azure/service-health/service-health-portal-update
Microsoft – Azure Virtual Desktop Insights
Microsoft guidance for investigating AVD connectivity, latency, connection reliability and user-impacting connection problems.
https://learn.microsoft.com/azure/virtual-desktop/insights-use-cases
Microsoft – AVD Diagnostics and Log Analytics
Explains AVD diagnostic categories including connections, host registration, feed subscriptions and management activity.
https://learn.microsoft.com/en-us/azure/virtual-desktop/diagnostics-log-analytics
Microsoft – Azure App Service Diagnostics
Guidance for diagnosing availability, performance, networking and application issues affecting Azure App Service.
https://learn.microsoft.com/en-us/azure/app-service/overview-diagnostics
Disclaimer: Nerdio Manager functionality and health thresholds may change between releases. Always validate current behaviour against the latest Nerdio and Microsoft documentation before changing production monitoring thresholds.
Click Here To Return To Blog